What is Einstein Platform Services?
Einstein Platform Services allows developers to develop AI-powered custom models which can be used to solve an array of real-life use-cases. It empowers developers with a powerful set of Application Programming Interfaces (APIs) for building intelligent and predictive app experiences. Today, Einstein Platform Services include:
- Einstein Image Classification (Einstein Vision)
- Einstein Object Detection (Einstein Vision)
- Einstein Intent (Einstein Language)
- Einstein Sentiment (Einstein Language)
Create, Train and predict
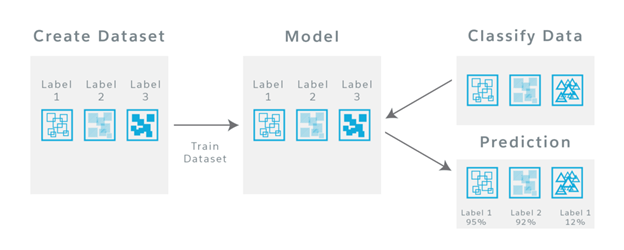
Using Einstein Platform Services is a simple 3 steps process, you need to create and upload dataset like text and image data, which can be used for training a model. Once the dataset is uploaded it can be used to train the model. This trained model predicts which class a new input falls into based on the predefined classes specified in your training dataset.
 |
| Einstein Platform Services flow |
Note: If the predictions are not accurate we can use feedback APIs and Model’s confusion matrix to analyze the training status
Before you start, if this is the first time you are going to use and explore Einstein platform APIs, I recommend going through Trailhead modules. Once you gather basic knowledge about Einstein Platform you can jump start with Einstein Vision and Language Model Builder and then learn more complex concepts about Einstein Platform Services.
What is the Confusion Matrix
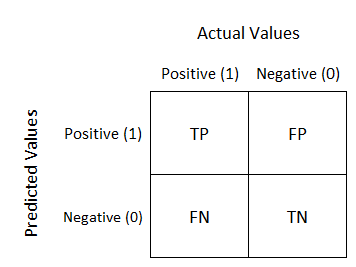
A confusion matrix is a specific table layout that visualizes the performance of an algorithm. In Salesforce, you can use this grid of values to evaluate the performance of Einstein Vision and Language models.
The statistics derived from the confusion matrix can be used further to analyse, optimize or refactor the dataset. For example, you can use the information to identify whether you need any label correction in the dataset or need to introduce a new label. You will see how it can be done in our example.
 |
| Typical Confusion Matrix |
- True positive (TP) and True negative (TN) where the model predicts image/statement accurately.
- False positive (FP) and False negative (FN) are Type-I and Type-II errors
Note:In statistical hypothesis testing, a type I error is the rejection of a true null hypothesis, while a type II error is the non-rejection of a false null hypothesis
There are a number of metrics that can be derived from the confusion matrix which measure the performance of the model. Most commonly used metrics are:
There are a number of metrics that can be derived from the confusion matrix which measure the performance of the model. Most commonly used metrics are:
- Precision
- Recall
- F1-scores
Note: Details about formulas and calculations can be found here
Accessing Model Metric
Model metrics for a model returns the f1 score, accuracy, and confusion matrix. The combination of these metrics gives you a picture of model accuracy and how well the model will perform.
Accessing Image Model’s Metric
Accessing Language Model’s Metric
Note: This call returns the metrics for the last epoch in the training used to create the model, to see the metrics for each epoch use Learning Curve endpoint (/lc)
The call to get the model metrics returns a response similar to this JSON.
The call to get the model metrics returns a response similar to this JSON.
Start building the matrix by writing labels vertically and horizontally. In given example you can see two labels which can be placed as shown below:

Start placing the confusionMatrix contents for each label

In the grid, all the diagonal values are considered to be accurate prediction by model, whereas non-diagonal values represent errors. Here in above example you can see a couple of images labelled as Beaches are identified as Mountains
How metric data is calculated
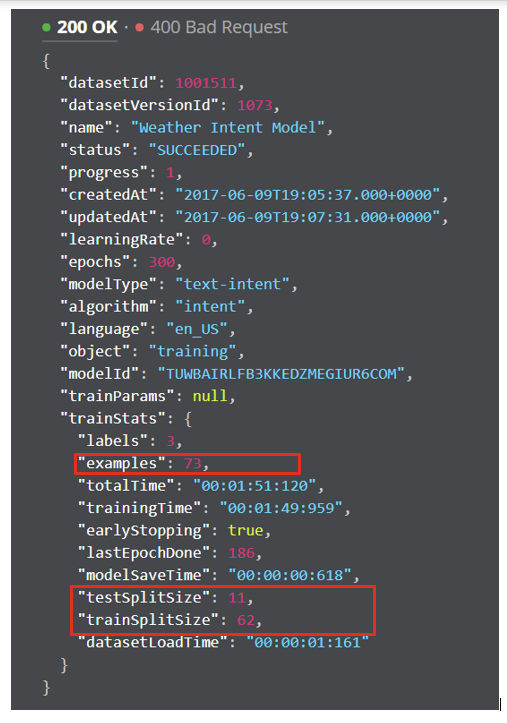
When model training begins from the given dataset, a portion of the data set is used for actual model training and other part is used to test the model. The ratio of test data versus training data is called the split ratio.
The developer can define this ratio by setting trainSplitRatio parameter of /train endpoint. The default values for the image data is 10% whereas 20% of data is used while testing the text-based models.
The developer can define this ratio by setting trainSplitRatio parameter of /train endpoint. The default values for the image data is 10% whereas 20% of data is used while testing the text-based models.
 |
| Sample train status response with total examples, trainSplitSize and testSpiltSize |
Optimising a Model with the Confusion Matrix
So far you know, how to get training status, check and use trainSplitRatio parameter, use of model metrics and build/read confusion matrix.
You have the visual explanation of your model’s accuracy, you can use this information to optimize the future predictions by optimizing dataset and retrain the model. Remember the ideal confusion matrix should have all the numbers placed diagonally.
Identifying Misclassified data is the most important steps in order to optimize your model. This can be done manually by scanning every item(image/text) and it’s label in the dataset (optimal for a small set of data)or by using /predict endpoint for every image/text in the dataset.
- Sometimes, the data is added with the wrong label which can be quickly fixed by renaming the label and created new dataset and train new model.
- For some confusing entities which might belong to 1 or more labels can be removed or you can introduce new label for such items.
- Adding more data to the dataset is always the best approach to increase the training accuracy of the model. You can also change the /trainSplitRatio parameter for better test results.
- Using a feedback loop to improve the model’s prediction capabilities by using the model’s misclassified data to train new versions of the model
Additional Resources
Documentation: Model Confusion Matrix , Einstein Platform Services
Other Resource: Get Started With Building Einstein Vision and Language Models
Trailhead Project: Quick Start: Einstein Image Classification


Comments
Post a Comment